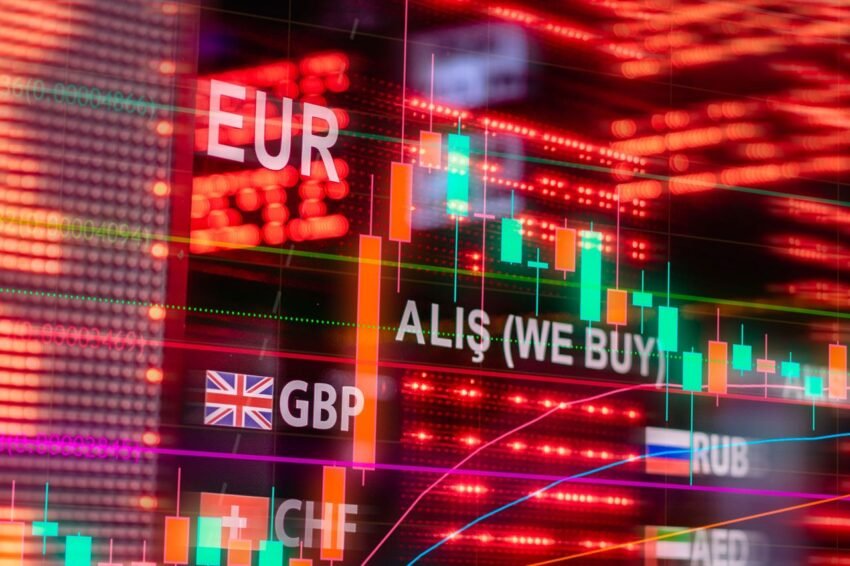
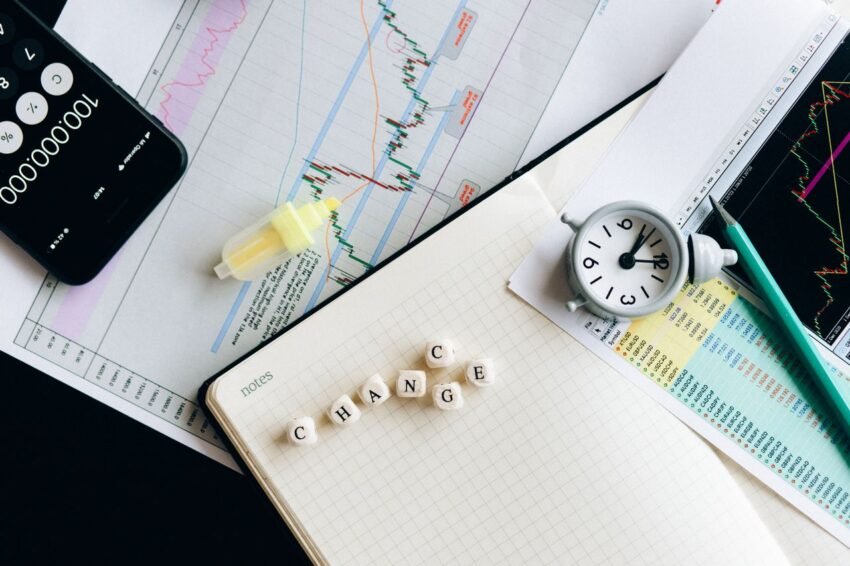
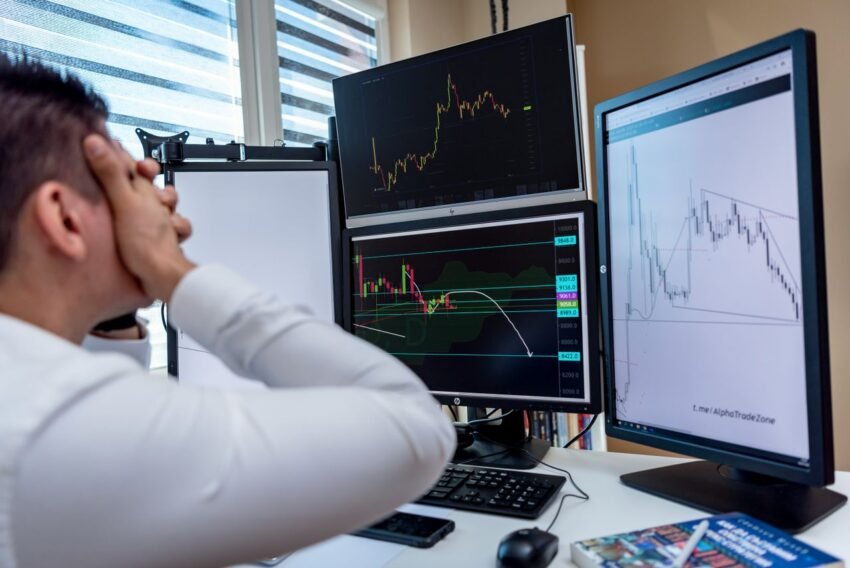
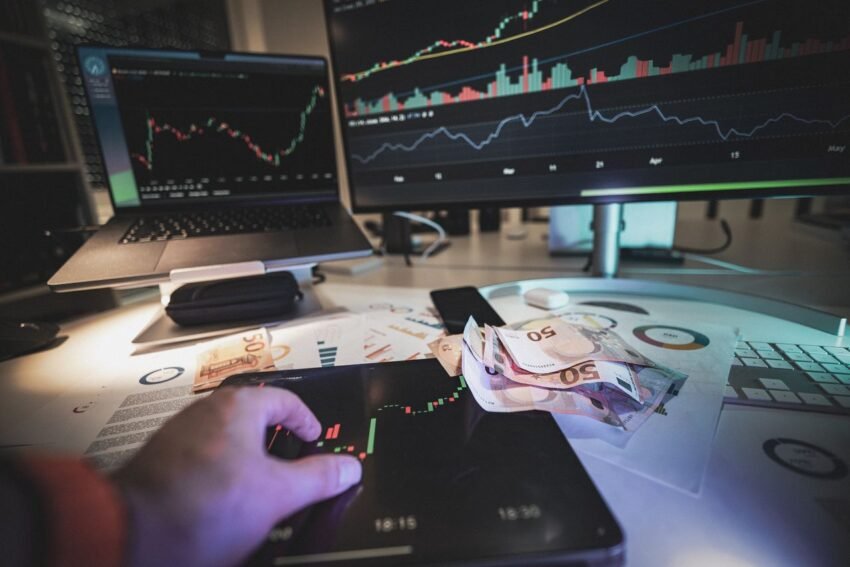
In technical analysis, relying on a single timeframe is like trying to navigate a city with a microscope. A 5-minute chart might show a clear downtrend, prompting a short entry, while the daily chart shows the exact same price resting on a major multi-month support level. Within minutes, the higher-timeframe buyers step in, wiping out…
What is Price Action Trading? Naked Chart Strategies Explained
In a world filled with thousands of technical indicators—from Stochastic Oscillators to MACD and Bollinger Bands—Price Action Trading strips away the clutter. It is the discipline of making trading decisions based purely on historical price movement displayed on a clean, indicator-free price chart—often referred to as a “naked chart.” Rather than relying on lagging indicators…
How to Trade Trendlines and Channels Effectively
Trendlines and price channels are among the most fundamental yet powerful tools in technical analysis. While horizontal support and resistance levels map static price barriers, trendlines provide a dynamic view of market momentum, revealing the rate at which supply or demand is shifting over time. When mastered, trendlines and channels help you identify higher-probability entry…
Chart Patterns 101: Head and Shoulders, Double Tops, and Triangles
While technical indicators perform mathematical calculations on historical prices, chart patterns allow traders to read raw price action directly. Chart patterns are distinct geometric formations created by price movements over time. They represent the collective psychology of market participants—visualizing the ongoing tug-of-war between buyers (bulls) and sellers (bears). By recognizing these recurring structures, traders can…
Fibonacci Retracement in Forex: How to Pinpoint Entry Levels
Among the wide array of technical tools used by foreign exchange traders, Fibonacci Retracement stands out as one of the most natural, reliable methods for identifying high-probability entry points. Named after the 13th-century Italian mathematician Leonardo Fibonacci, this tool applies mathematical ratios derived from the Fibonacci sequence to financial price action. In forex trading, markets…
Understanding RSI (Relative Strength Index) for Overbought/Oversold Signals
Developed by J. Welles Wilder Jr. in 1978, the Relative Strength Index (RSI) remains one of the most widely used and effective technical indicators in modern financial trading. Belonging to the momentum oscillator family, the RSI measures the speed and magnitude of recent price movements to help traders gauge whether an asset is overvalued or…
Moving Averages (SMA & EMA): How to Use Them for Trend Identification
In financial market trading, Moving Averages (MAs) are among the most versatile and widely used technical analysis tools. At their core, moving averages smooth out erratic price action by filtering out short-term market noise, revealing the underlying market direction over a specified period. Whether you trade forex, equities, or commodities, mastering how to apply and…
Top 5 Technical Indicators Every Forex Trader Should Master
In the foreign exchange market, raw price charts tell a story, but technical indicators help translate that story into actionable trading decisions. Indicators are mathematical calculations based on historical price, volume, or open interest that assist traders in identifying market trends, momentum shifts, volatility cycles, and potential reversal zones. Rather than cluttering your charts with…
Support and Resistance Levels: How to Identify and Trade Key Zones
In technical analysis, Support and Resistance (S/R) form the core foundation of chart reading. Whether you are trading forex, equities, or commodities, market prices do not move in a straight line—they move in waves driven by shifts in supply and demand. Understanding where demand overwhelms supply (Support) and where supply overwhelms demand (Resistance) allows traders…
How to Read Forex Candlestick Charts: Essential Patterns for Beginners
Candlestick charts are the foundational language of technical analysis in forex trading. Originating in 18th-century Japan to track rice prices, candlesticks provide a visual representation of market sentiment, price momentum, and the ongoing tug-of-war between buyers (bulls) and sellers (bears). Mastering how to read individual candles and multi-candle formations allows traders to spot potential trend…